NexLP Presentation
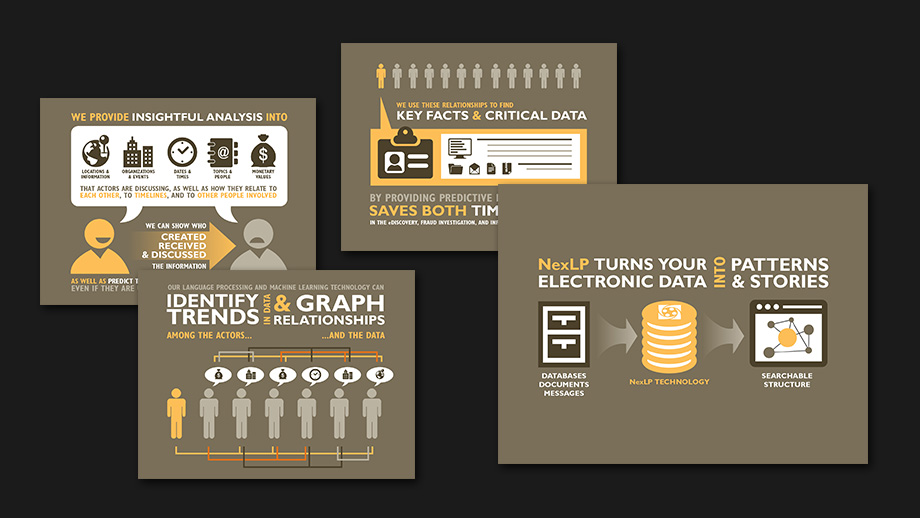
Infographic created to explain a revolutionary new software that can interpret large amounts of data and form relationships between the elements to give it context and make it usable. Created to work both horizontally and vertically.
